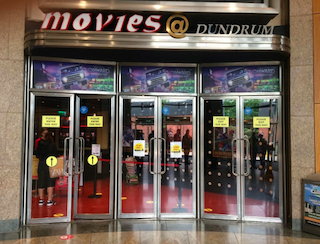
 Recency frequency monetary modeling is a proven marketing model for behavior-based customer segmentation. By helping marketers analyze and action their customers’ behavior, it drives the strategy that sits behind successful marketing campaigns. But how does a cinema circuit apply the RFM model to post-COVID closures? In October 2021 Showtime launched our new Customer Analytics product at the UK Cinema Association Conference in London. There we presented a case study of how we applied the recency frequency monetary model to the Irish cinema chain Movies@ to help them bring audiences back to their cinemas for Universal Pictures release of the James Bond blockbuster No Time to Die.
We have been providing analytics to our customers since Showtime began in 2015. First, we developed Showtime Insights to enable a simple view of operational data. We then went on to build Showtime Engage, our marketing software, which provides a view of customer attributes and an engine to segment and communicate with them. What we learned as time went on and people became more advanced in their marketing was that many of our customers had a shared frustration: They had no single view of their base.
There was just no way to look at a customer base and understand behaviors around who is visiting more, or less, who we are losing and who we are gaining. That’s how the RFM Dashboard came about. We wanted to create a simple way they could analyze an entire customer base dynamically in real time.
Understanding the numbers behind a cinema circuit’s customer base is crucial to how the marketing strategy should be designed. Only by establishing what is currently happening in the customer base, and what has historically happened in that base, can we determine what needs to happen in the future, to at worst get back to the 2019 numbers and, ultimately, lead to an uplift in that business.
 The changing lifestyle of consumers has caused shifts in behavior and traditional trends. Takeaway food has continued in its increasing popularity even in the wake of the pandemic, and the restaurant boom has slowed. Work patterns have changed so fewer people are leaving their homes, shopping centers – many of which are home to multiplex theatres – are experiencing footfall challenges, and with a surge in the number of people moving home or moving out of cities the traditional loyal customer base is now changing. Add all of this to the lingering fear of COVID and it results in a major shift in the make-up and behavior of a customer base.
In any business there is customer churn, and it is critical to understand and track it. If new customers typically account for 25 percent to 40 percent of a customer base, exhibitors are now faced with the additional task of making up for the lost time during closures where no new business was generated and compensate not only for the organic number of lost customers, but also for the additional churn associated with the challenges of the pandemic.
We cannot assume that we can go back to the way of doing things pre-COVID and see the same results from our marketing efforts. We are dealing with a different picture of the market overall, of customer bases within circuits, right down to customer bases within individual cinemas, and we can no longer rely solely on loyalty program data as a navigation. As a result, we need to break it down to the different cohorts of individuals.
By having a view of this data, we can start to understand metrics like how many new customers we need a month, how many we lose, what our customer churn was pre-COVID, what it is now and how effective our loyalty program is.
By getting a monetary value associated with each customer we then have visibility of who our most valuable customers are, making sure we are taking the appropriate action to either retain them, or bring them back if they are in danger of lapsing or have already lapsed.
 As data specialists we have been asked to perform loyalty analysis and customer profile analysis for clients as project work, to help them with redesigning their loyalty programs. It’s always been very manual for them to be able to do this; there were no tools available to perform this analysis easily, so understanding who is at what level of the program, who should be moving up a tier etc. was all very difficult.
As part of our new offering, we record each customer's movement in the RFM dashboard to see how the model is changing over time, so you can see how customers move and whether their recency and frequency scores improve or worsen. This then allows you to gauge how your strategies are working or how you might need to change how you target customers.
Bond has had major impact on driving positive change, particularly new and recent customers. But lapsing was significant among non-Bond visitors meaning there was much more action for us to take
The next step in our strategy was to look at the top ten films that customers who had seen either of the two previous Bond movies – Skyfall and Spectre – had come to see in the following 12 months. With an eclectic mix of films drawing this subset of customers back, we saw that post Bond behavior was an average of 3.7 visits during that period.
Using these movies as our reference, we matched them to upcoming films and created segmented audience campaigns using Showtime Engage to drive them back. We also exported lookalike audiences from Showtime Engage into the Movies@ social accounts to create targeted ads to reach our non-marketable customers.
 Some of the larger global circuits have advanced loyalty programs and had invested in RFM modelling before through a consultant, but it was so manual that by the time the data had been collated and exported back out it was no longer relevant and so no longer usable. This manual analysis meant they couldn’t react quickly enough to prevent losing customers and had no way to see if their targeting strategies were working.
To counter this, we wanted to create a way that our customers could analyze not just their loyalty customers, but their entire base, and do it in real time. We can now record each customer’s RFM and other attributes movements on a daily basis, which ties in the data to use with other marketing tools to see how strategies can improve scores.
Our efforts produced positive results for Movies@. While the exhibitor doesn’t share specific box officer numbers, they are allowing us to publish the followings insights.
The overall box office numbers in the United Kingdom were $161,176,379 for Skyfall and $131,368,437 for No Time to Die, which means that No Time to Die achieved 81 percent of Skyfall’s gross box office in the UK. For Movies@ the box office earnings for No Time to Die were 102 percent of what Skyfall earned, which means in comparison that they performed better than the overall UK market when comparing. and this was with a 60 percent capacity restriction during No Time to Die. And Movies@ also saw a 23 percent increase in pre-sales for No Time to Die compared with Skyfall, again even with the 60 percent capacity restrictions.
[Editor’s Note: A more detailed version of this article can be read on the Showtime Analytics website at https://bit.ly/3Hg7irV]
This article was co-written by Deirdre Moran product manager, and Mark de Quervain, director of client services & strategy at Showtime Analytics.